
Ok, I’ll freely admit it. Charge me as guilty.
I relied too much on gut instincts and anecdotal evidence to make business decisions.
And it was monumentally frustrating. 🤯
When I was in my last two roles, I often asked my team to identify leading indicators of churn risk and expansion opportunities. But it was nearly impossible to find these.

To be clear, I’m not throwing my teams under the bus here. We were running into limitations with tools, systems, and expertise. They did an amazing job with what they had available.
Since then, I’ve discovered my experience is not unique. I’ve discussed this issue with dozens of business executives. And almost all of them have expressed frustration with how difficult it is to find leading indicators of churn and expansion.
So, I started asking why this problem still exists. 🤷🏽♂️
Is it simply a matter of data maturity or are there other factors at play? 🤔
👆🏾 This is why I started Tingono. My frustration with this problem mounted to a point where I could no longer ignore it!
The importance of a data-driven system
A major challenge to solving this problem is getting your arms around all the event data generated from a customer journey. I tend to think of this data from the flip side. I think of it as data from the company's revenue lifecycle. 
By this, I mean data created from all the customer interactions with Marketing, Sales, Product, and Service. To execute the right actions at the right time, it’s necessary to consider all these data points.
This is not an easy task. But it’s not impossible either…
We set out to build a data-driven system to solve this problem. A system that would ditch the proxies and focus on specific actions that expand revenue retention.
I recently read a blog post by Joe Floyd and Wenz Xing from Emergence about how Event-Driven Systems are the next wave of customer engagement. This captures our viewpoint at Tingono quite well.
In fact, our vision of a data-driven system is quite aligned with the idea of an event-driven system. So, I'll spend the next few blog posts exploring this vision in more detail.
So, what does an event-driven system look like in real life?
From my perspective, a true event-driven system has three distinct but reinforcing components:

- A 360° Customer View provides the details of all the ways a customer is engaging with your company.
- Predictions create leading indicators, providing you advance notice of an opportunity so you can be proactive rather than reactive. In our case, predictions reveal opportunities to expand revenue for each customer account.
- Automation & Orchestration are both required to make an entire GTM team successful. With automation setting up a single task to run on its own, and orchestration setting up multiple tasks to run as part of a process or workflow.
Creating a 360° customer view
A 360-degree view should provide a holistic view of your customer engagement at any given point in time.
Meaning, it provides a view that anyone in your GTM team can access. And this view will help each team member better understand all the ways in which a customer is interacting with your company.
Specifically, this view includes:
- A customer profile should include a general overview of each customer. For a company, it would include things like Account Name, Industry, Revenue, Key Customer Contacts (i.e. your champion), etc.
- Customer relationship details. This provides details of your relationship with the customer. For example, their next renewal, MRR, internal roles assigned to the customer (e.g. CSM, AE, etc.), and products they have purchased.
- Customer Signals. This is the longitudinal or event data mentioned above. It would include:
- Sales: Sales calls, call duration, Gong data, etc.
- Marketing: Webinars viewed, Newsletters opened, etc.
- Product: Logins, API calls made, Features used, etc.
- Customer Success: Onboarding duration, adoption percentage, NPS/CSAT score, etc.
- Support: Tickets logged, Ticket types, Ticket status, etc.
- User-level data. In addition to company data, user-level data is extremely valuable as well. This consists of profile data (e.g., Name, Title, User Role, etc.), relationship data (i.e. last contact date), and the signal data mentioned above.
So, what might all this look like? Here’s a sneak peek of our WIP 360° customer view: 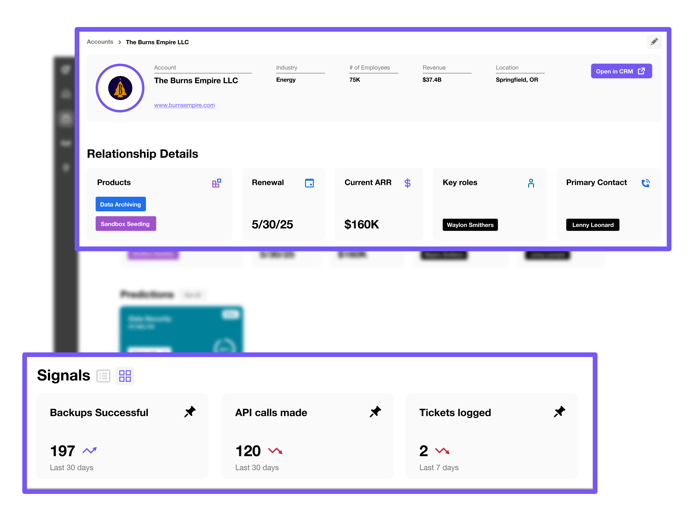 While a 360° customer view is undeniably valuable, it really is just table stakes to get your GTM team on the same page. So, it’s a key foundational piece.
Please tune in for part 2 of this blog where I’ll share more details about what the Predictions piece of this solution will look like. This is the real heart of a data-driven/events-driven solution, and I can’t wait to share more about this piece.
Check out the other 3 parts of the series:


